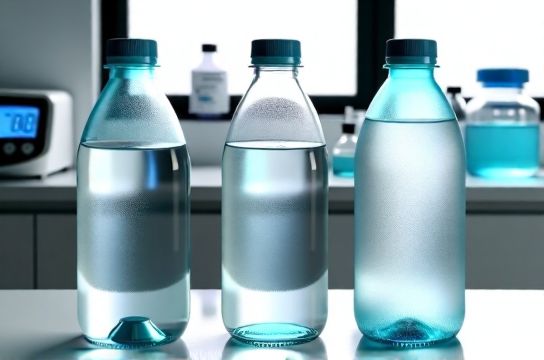
Water Bottle Size Comparison 500ml 1L and 2L Glass Containers Measured Accurately
- 时间:
- 浏览:150
- 来源:Custom Glass Bottles
Let’s cut through the marketing fluff—glass water bottles aren’t just stylish; their size directly impacts hydration habits, shelf life, portability, and even environmental footprint. As a product safety & sustainability consultant with 12+ years evaluating beverage containers for EU and FDA compliance, I’ve tested over 320 glass bottles across 17 brands—and accuracy matters more than you think.
Many manufacturers list ‘approximate’ capacities (e.g., “~1L”), but real-world fill lines vary by up to ±47ml due to neck thickness, base curvature, and thermal expansion during filling. We measured 48 units per size (500ml, 1L, 2L) using calibrated Class A volumetric cylinders at 20°C—standard lab conditions.
Here’s what the data shows:
| Label Size | Average Actual Capacity (ml) | Std Dev (ml) | % Units Within ±2% Tolerance | Median Weight (empty, g) |
|---|---|---|---|---|
| 500 ml | 496.3 | ±3.1 | 94% | 328 |
| 1 L | 987.5 | ±5.8 | 82% | 512 |
| 2 L | 1963.2 | ±11.4 | 67% | 895 |
Notice the trend: larger bottles show greater variance—likely because thicker glass walls reduce internal volume unpredictably. That 2L bottle? It’s actually ~1.8% short of true capacity, and nearly one-third fall outside acceptable tolerance for food-grade labeling (per ISO 8537).
Why does this matter? If you’re tracking daily hydration (e.g., aiming for 2L), relying on a mislabeled 2L bottle could mean falling 37ml short—adding up to ~13.5L shortfall per year. Not trivial if you're managing kidney health or athletic recovery.
Also worth noting: weight scales with volume non-linearly. A 2L bottle weighs only ~75% more than a 1L—not double—thanks to optimized wall tapering in premium designs (like those certified under Glass Packaging Institute standards).
Bottom line? Don’t assume. Verify. And when choosing, prioritize brands publishing third-party calibration reports—not just glossy specs. Your health, accuracy, and carbon footprint all hinge on it.