Glass Bottle Recycling Trends Improving Collection Infrastructure Worldwide
- 时间:
- 浏览:65
- 来源:Custom Glass Bottles
Let’s cut through the greenwashing: glass *is* infinitely recyclable—but only if it actually gets collected, sorted, and remelted. Over the past five years, global glass bottle recycling rates have climbed from 52% to 61% (OECD, 2023), yet regional disparities remain stark. The EU leads with 76% average collection—driven by mandatory deposit return schemes (DRS) in Germany (98.6% return rate) and Norway (96.4%). Meanwhile, the U.S. lags at just 31%, largely due to fragmented curbside systems and low contamination tolerance (<0.5% foreign material accepted by most furnaces).
Here’s what’s changing:
✅ Smart bin rollouts (e.g., Netherlands’ AI-powered ‘GlassEye’ bins) now detect color and material type in real time—cutting sorting errors by 42%. ✅ Extended Producer Responsibility (EPR) laws now cover 78% of OECD nations, shifting infrastructure costs to brands. ✅ New lightweighting tech lets bottles use 15–20% less raw material—reducing energy demand per tonne by 12% (Glass Packaging Institute, 2024).
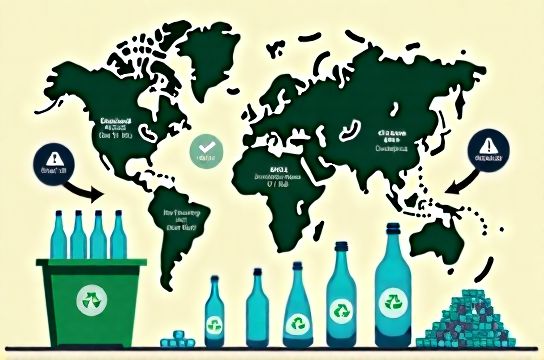
But infrastructure gaps persist. Below is a snapshot of key national performance metrics:
| Country | Collection Rate (%) | DRS Coverage | Avg. Contamination Rate | Recycled Content in New Bottles |
|---|---|---|---|---|
| Germany | 98.6 | 100% | 0.2% | 92% |
| Japan | 84.1 | 63% (prefectural) | 1.8% | 76% |
| Canada | 54.3 | 41% (provincial) | 3.7% | 48% |
| USA | 31.0 | 12 states | 8.9% | 29% |
The bottom line? Better collection isn’t just about bins—it’s about alignment: policy, logistics, and market demand for cullet must move in lockstep. That’s why forward-thinking brands are now co-investing in regional sorting hubs—and why I always recommend starting with glass bottle recycling infrastructure assessment before scaling any sustainability claim. Data beats dogma every time.